
The purpose of this tutorial is to teach you how to process data with Pandas DataFrame.
At the end of this tutorial, you will be able to:
- Load a dataset
- Explore data and rename columns
- Check and select columns
- Change columns’ names
- Describe data
- Identify missing values
- Iterate over rows and columns
- Group data items
- Concenate dataframes
Table of contents:
- Resources
- Loading Data
- Exploring Data and Renaming Columns
- Checking and Selecting Columns
- Changing the Columns’ Names
- Describing Data
- Missing Values
- Iterating Over Rows and Columns
- Grouping
- Concatenating
Interested in learning more Data Analytics and Data Science?
Check out our range of data science apprenticeships that will teach you everything you need to know about advanced Data Analysis with Python and more. Apprenticeships are accessible via your employer and are 100% funded by the UK government through the Apprenticeship Levy.
👉RECOMMENDED READING: 
Tutorial resources
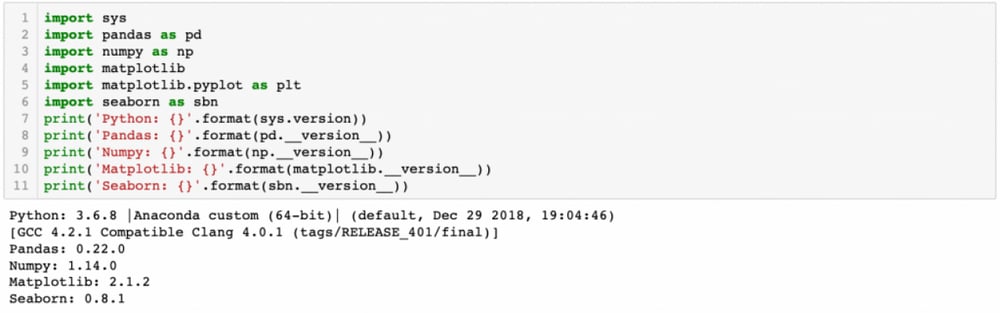
For this tutorial, the libraries we will need are Python, Numpy, Pandas, and Matplotlib. The version of the libraries that we will be using in this tutorial is as follows.
Loading data
For this tutorial, we will be working on Titanic dataset. You can download it from https://web.stanford.edu/class/archive/cs/cs109/cs109.1166/problem12.html.
Download the titanic.csv file to your computer, read the data using the following piece of code:
data = pd.read_csv(“your_file_location/titanic.csv”)

Exploring data and renaming columns
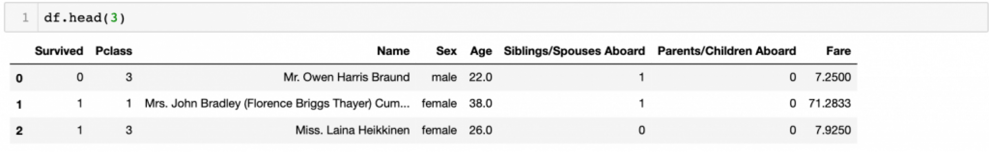
First of all, let’s look at the first rows in the dataset to see what it looks like:
Note:
By entering a number into the brackets such as df.head(3), you specify how many columns to be shown.
If you leave it empty, it displays the first five rows by default.
Checking and selecting columns
Next, let’s check what columns do we have.

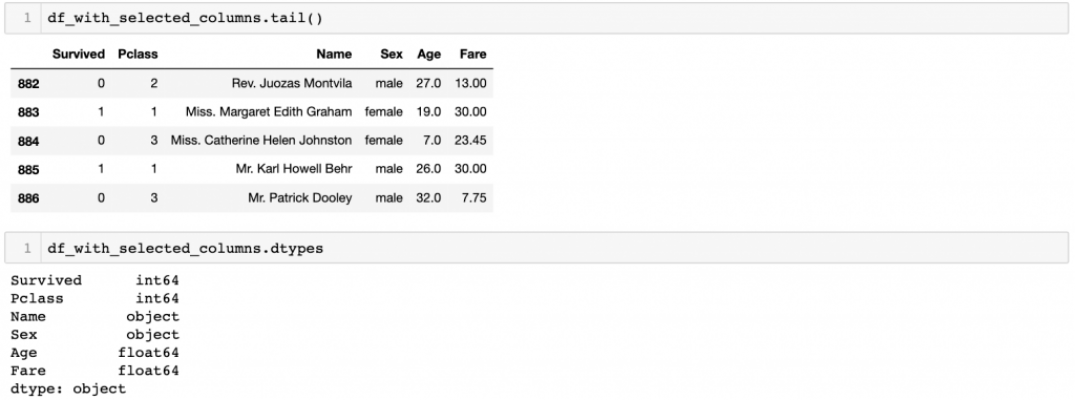
Then, we can specify what columns to use. To do that, we select the columns. For example

Then, we can print the last five rows and datatypes to see how new dataframe looks like.
Changing the Column names
Let’s change the name of the columns. We will be working on our original data with eight columns.
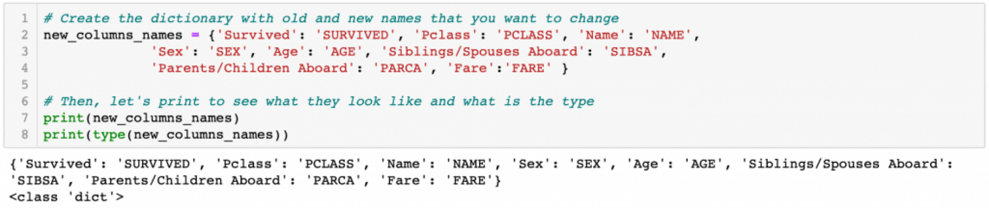
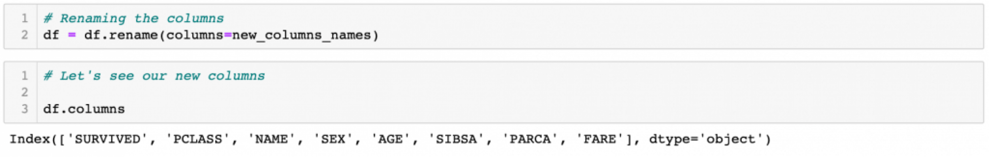
As can be seen above, we have successfully created the dictionary. Now, we can change the names of the columns, by passing that dict into parameter columns in rename().
Describing data
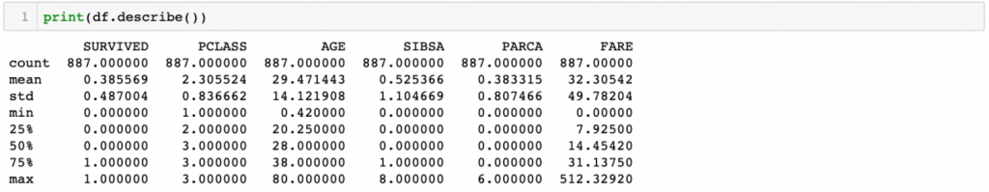
Let’s check some basic statistics to understand our data better.
The describe functions give us descriptive statistics that summarise the count, mean, standard deviation, minimum. maximum, and quantile values. NaN values are ignored by default.
Missing Values
Pandas treat None and NaN for indicating missing or null values in data. Various functions are available to detect the missing values in Pandas DataFrame such as:
isnull()
notnull()
Note:
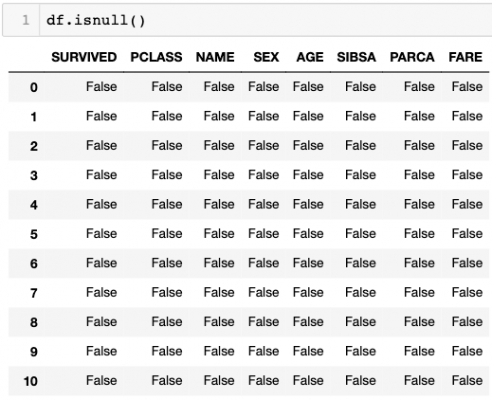
df.isnull() function displays all the values in the data as True or False. The True values represents the null values.
df.notnull() does the opposite of this function.
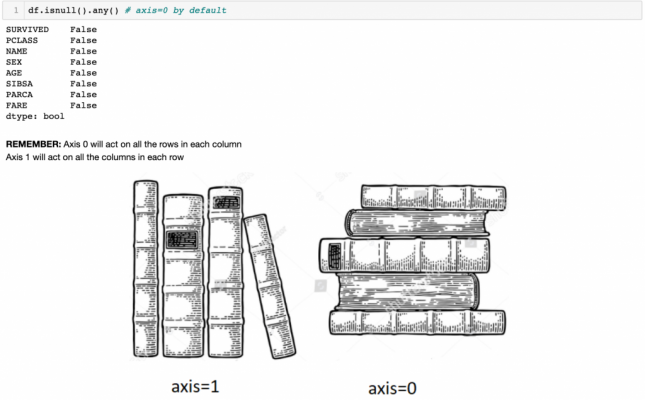
Using any(), we can see the summary of each column in terms of if there are any missing values.
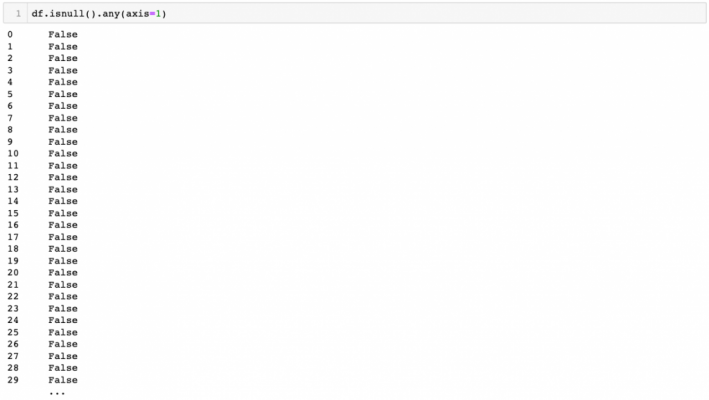
Let’s summarise the values according to axis=1.
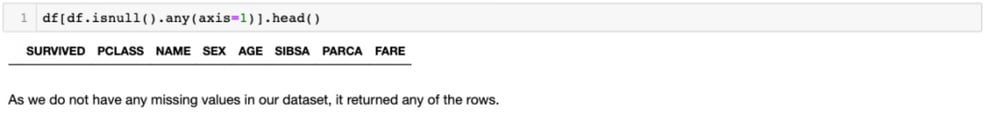
Nevertheless, what if we want to use “isnull()” function to display all rows where df has null values? In other words, what if we want to display the actual rows with null values instead of this df with True or False cells. To do that, we write the following code:
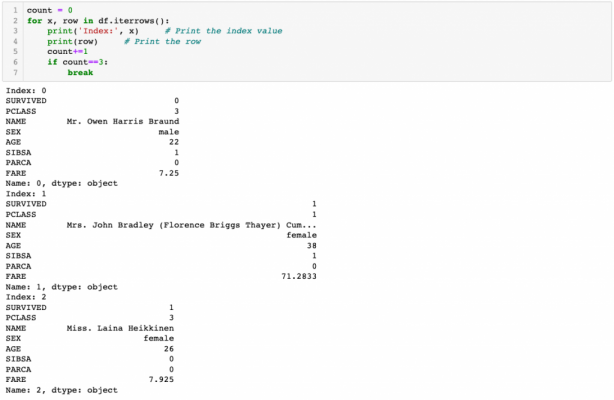
Iterating over rows and columns
Let’s start with iterating rows and using self-made functions. To iterate throw rows, we use iterrows() function. See the example below.
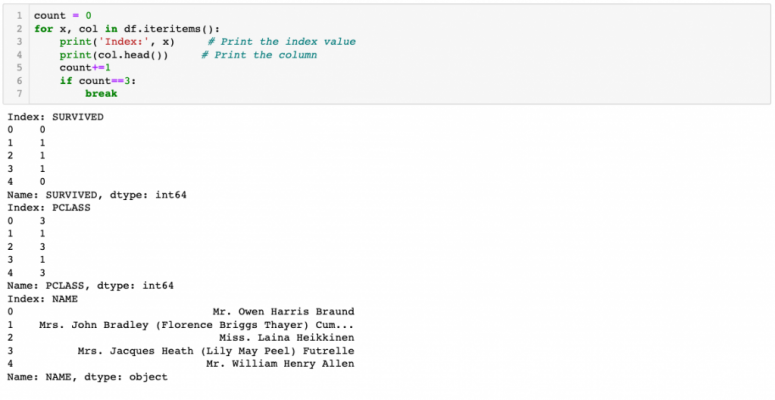
To iterate throw columns, we use iteritems() function. See the example below.
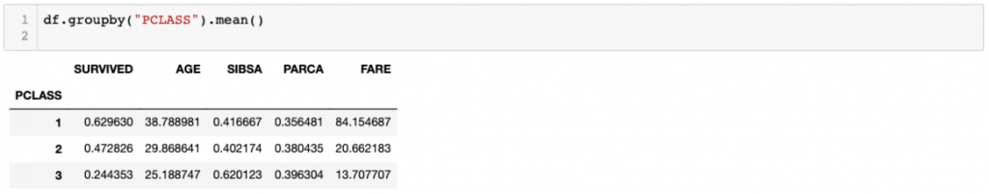
Grouping
Pandas groupby() function is used to split the data into groups based on criteria. In other words, grouping is used to provide a mapping of labels to group names.
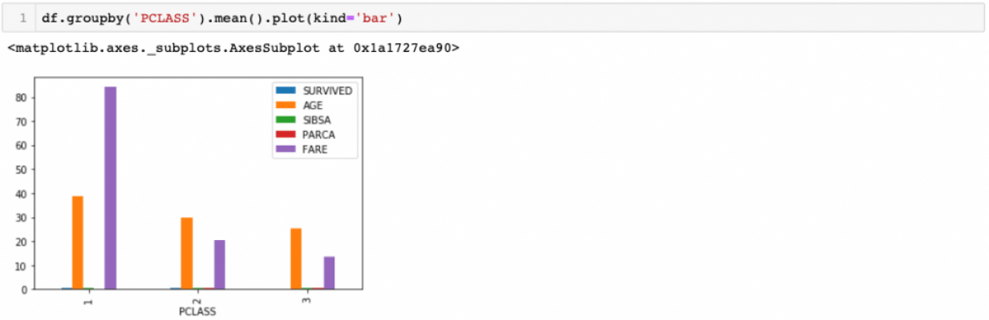
Let’s group our data according to PCLASS.
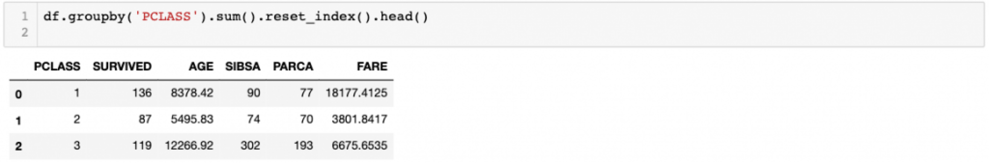
To resume PCLASS as a column, use reset_index.
We can plot the returned dataframe.
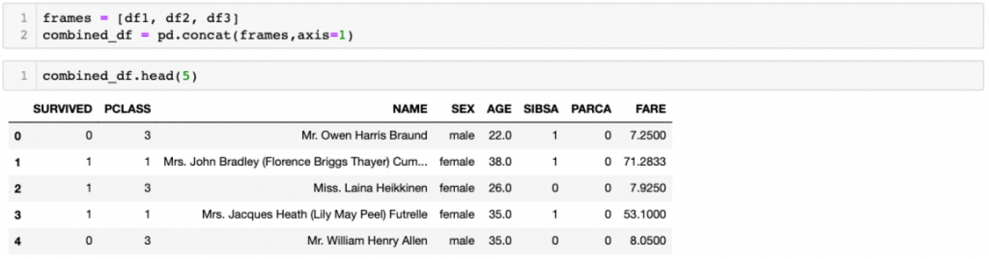
Concatenating
Pandas provides several functions for easily combining DataFrame. One of these functions is concat().
There are eight columns in our dataframe namely SURVIVED, PCLASS, NAME, SEX, AGE, SIBSA, PARCA, and FARE. Let’s create three different dataframes from our dataframe (df), then concat them with concat() function.
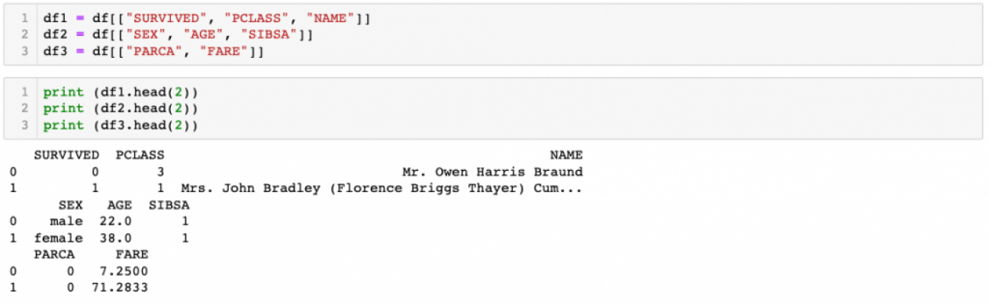
Now, we have three different dataframes.
Another way of combining the DataFrame is by using append() instance methods. They concatenate along axis=0.
Summary
Congratulations, you have reached the end of the Data Processing With Pandas DataFrame!

Author: Dilek Celik
IBM, Stanford University and Massachusetts Institute of Technology certified professional in Data Science and Machine Learning with advance Java, Python, R and Machine Learning expertise and experiences.
Learn more about Cambridge Spark's Data Science programmes
Get in touch below to find out more about our Data Science programmes including our advanced Level 7 AI and Data Science apprenticeship:
-1.png)
Enquire now
Fill out the following form and we’ll contact you within one business day to discuss and answer any questions you have about the programme. We look forward to speaking with you.
